Echocardiography as an indication of continuous-time cardiac quiescence
Executive Summary
This study evaluates B-mode echocardiography as a continuous-time indicator of cardiac quiescence for coronary CT angiography (CTA) gating. Using correlation-based deviation techniques, quiescent phases derived from echocardiography were compared to those from retrospective CT reconstructions in 10 patients, showing a high correlation (0.956) and non-inferior diagnostic quality. The findings suggest echocardiography can serve as a baseline for developing CT-compatible gating methods based on cardiac mechanics, such as seismocardiography (SCG) and impedance cardiography (ICG).
Answer Machine Insights
Q: How does echocardiography compare to CT in identifying cardiac quiescent phases?
Echocardiography-derived quiescent phases showed a high correlation (0.956) with CT-derived phases and comparable diagnostic quality.
Additionally, there was a correlation of 0.956 between the echocardiography- and CT-selected phases.
Q: What is the clinical significance of using echocardiography for CTA gating?
Echocardiography avoids ionizing radiation and provides real-time cardiac motion analysis, enabling safer and more accurate gating methods.
This utility of echocardiography is important because it allows for quiescence to be observed on a beat-by-beat basis without ionizing radiation.
Key Results
Correlation of 0.956 between echocardiography- and CT-derived quiescent phases.
No significant difference in diagnostic quality between echocardiography- and CT-selected phases (p > 0.91).
Visual Evidence
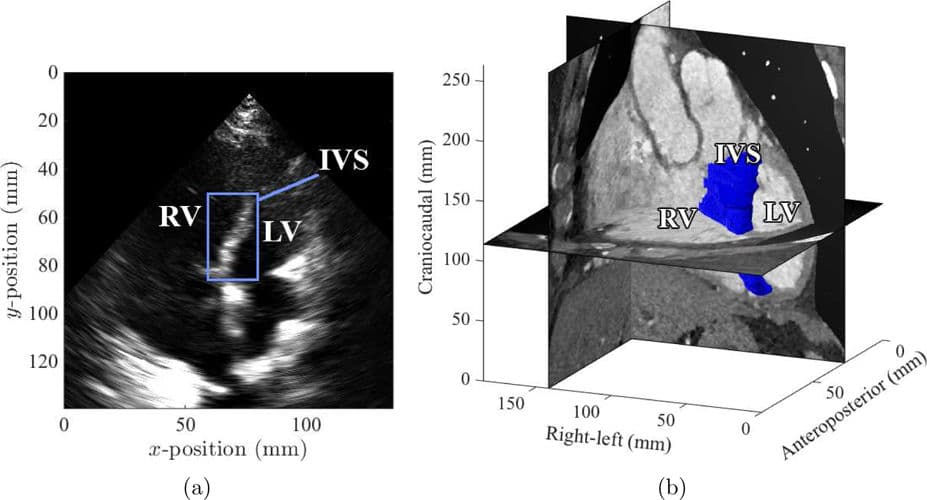
Figure 1. Location of the IVS for (a) echocardiography and (b) CT. For CT, the blue volume corresponds to the IVS, segmented using the techniques presented by Wick et al. (2015b).
Clinical Snapshot
Evidence Rating
Relevance
high Priority