Effect of the Airway Pressure on the Frequency Domain of Seismocardiographic Signal
Executive Summary
This study investigates the impact of intrathoracic pressure variations on the spectral characteristics of seismocardiographic (SCG) signals in 20 healthy subjects using a tri-axial accelerometer. Key findings include a redistribution of SCG energy between audible and subaudible frequency bands during breath-holding maneuvers, with subaudible-to-audible energy ratios (SAR) decreasing at zero airway pressure and increasing at lower pressures. These results suggest SAR as a potential feature for monitoring cardiac muscle function under varying pressure conditions.
Answer Machine Insights
Q: How does intrathoracic pressure affect SCG spectral characteristics?
Intrathoracic pressure variations redistribute SCG energy between audible and subaudible frequency bands, with lower pressures increasing SAR.
The intrathoracic pressure appears to affect cardiac dynamics and cause SCG energy redistribution between audible and subaudible frequency bands.
Q: What physiological mechanisms explain the observed SAR changes?
High left ventricular afterload associated with low intrathoracic pressure reduces cardiac muscle fiber contraction velocity, increasing energy in low-frequency SCG components.
First, low intrathoracic pressures are known to be associated with high LV afterload... cardiac muscle fibers contraction velocity decreases when the afterload increases, which might increase the energy associated with the low SCG frequency components.
Key Results
Subaudible-to-audible energy ratio (SAR) decreased significantly during breath-holding at zero airway pressure compared to normal breathing (p < 0.05).
SAR increased as airway pressure decreased during breath-holding maneuvers (p < 0.05).
Visual Evidence
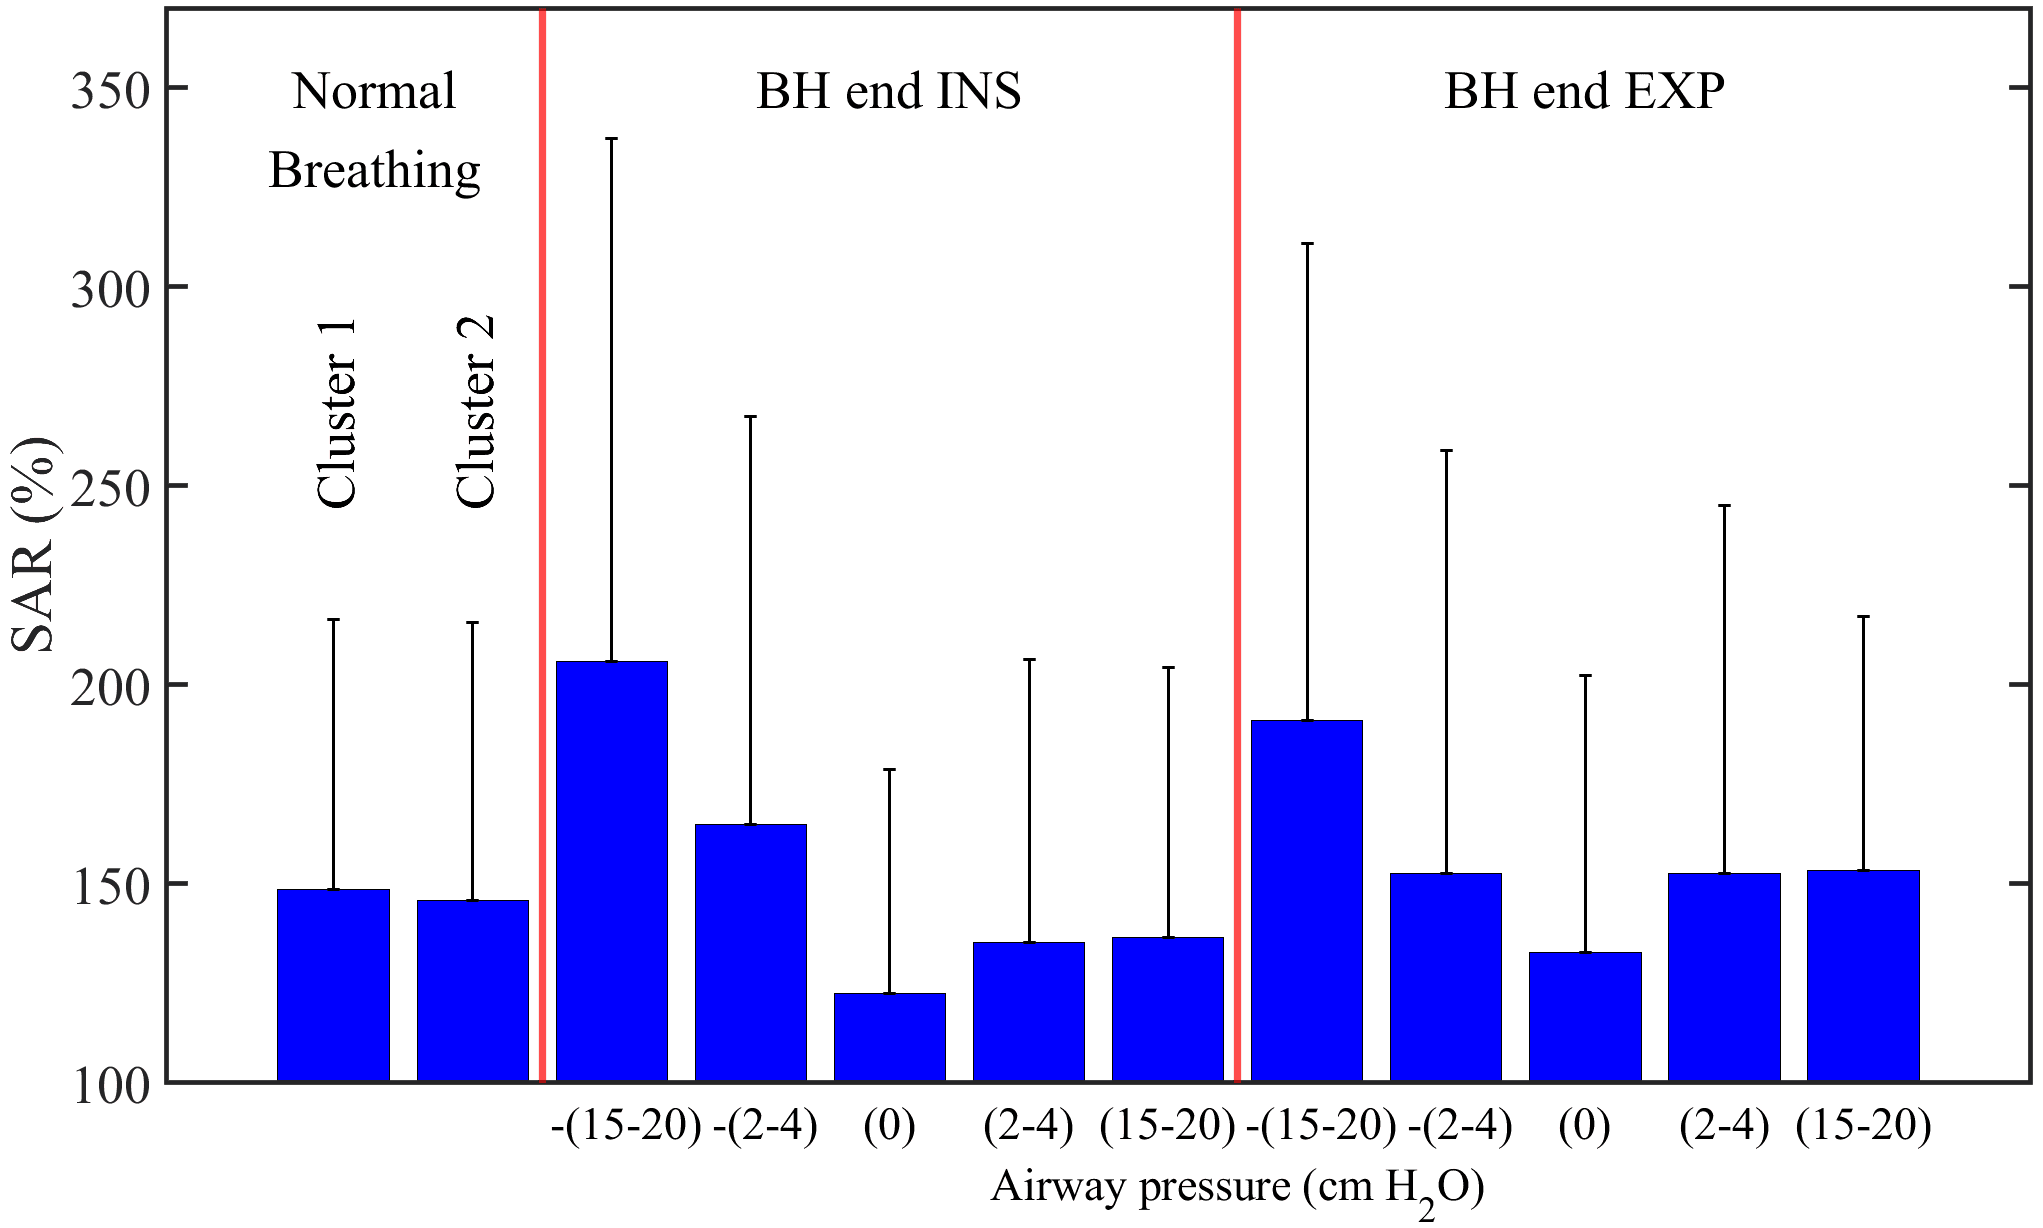
Figure 2. Subaudible to audible energy ratio (SAR) for NB clusters and BH cases at different airway pressures. The values in the figure represent the mean+std of SAR over all subjects.
Clinical Snapshot
Evidence Rating
Relevance
high Priority