Wearable Seismocardiography
Executive Summary
This study investigates the use of deep learning models to predict aortic hemodynamics and diagnose aortic valve pathologies using wearable seismocardiography (SCG) signals. A convolutional neural network (CNN) combined with a multi-layer perceptron (MLP) was trained on SCG scalograms and demographic data to predict peak systolic velocity (Vmax) and classify valve conditions, achieving ROC-AUC values of up to 95%. The results demonstrate strong agreement between SCG-based predictions and 4D flow MRI measurements, suggesting SCG as a cost-effective alternative or supplement for diagnosing aortic valve disease.
Answer Machine Insights
Q: How accurate is the SCG-based prediction of peak systolic velocity compared to 4D flow MRI?
The SCG-based prediction achieved a mean squared error of 0.2 m/s and a Pearson correlation coefficient of 0.76.
The peak systolic velocities predicted by our deep learning model were in good agreement with the velocities obtained using 4D flow MRI, as demonstrated by the low mean squared error of 0.2 m/s across ten random trials.
Q: What is the classification performance for different valve conditions?
ROC-AUC values were 92% for non-AS TAV, 95% for non-AS BAV, 81% for non-AS MAV, and 83% for AS.
The ROC-AUC values indicate the model’s performance on each of the four classes, with values of 91.8 ± 5.3%, 94.8 ± 5.1%, 81.2 ± 10.8%, and 83.1 ± 11.1% for non-AS TAV, non-AS BAV, non-AS MAV, and AS subjects, respectively.
Key Results
The deep learning model achieved a mean squared error of 0.2 m/s and a Pearson correlation coefficient of 0.76 (p≪0.01) for predicting Vmax compared to 4D flow MRI.
ROC-AUC values for classifying valve conditions were 92% for non-AS TAV, 95% for non-AS BAV, 81% for non-AS MAV, and 83% for AS.
Visual Evidence
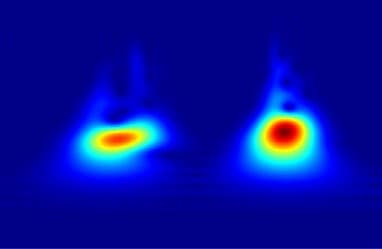
Fig. 2 a comparison of a raw and denoised SCG signal, b and c, the none-outlier and outlier pulses identified based on SQI scores for a healthy subject, d an example SCG pulse com- posed of two main features, e the scalogram of the signal in d representing the absolute value of its CWT coefficients
Clinical Snapshot
Evidence Rating
Relevance
high Priority