Detecting Aortic Valve-Induced Abnormal Flow with Seismocardiography and Cardiac MRI
Executive Summary
This study investigates the correlation between seismocardiography (SCG) signal features and cardiac MRI (CMR) metrics in healthy individuals and patients with aortic valve disease. Using a cohort of 28 healthy subjects and 6 patients, SCG energy levels were compared to CMR-derived metrics such as peak aortic velocity and flow rates, revealing significant correlations. Elevated SCG energy levels in valve disease patients corresponded to pathological flow abnormalities visualized by MRI, suggesting SCG's potential as a low-cost screening tool for aortic flow abnormalities.
Answer Machine Insights
Q: What is the significance of SCG energy levels in valve disease patients?
SCG energy levels in valve disease patients were elevated during late systole, corresponding to pathological flow abnormalities visualized by MRI.
Valve disease subjects almost uniformly show SCG energy levels above any observed in the normal cohort during late systole.
Q: How does SCG correlate with CMR metrics in healthy subjects?
Significant correlations were observed, such as peak aortic velocity correlating with low-frequency SCG energy (R=0.43, p=0.02).
MR-quantified flow and function parameters in the healthy cohort correlated with particular SCG energy levels, such as peak aortic velocity with low-frequency SCG (coefficient 0.43, significance 0.02).
Key Results
Correlation coefficient of 0.43 between peak aortic velocity and low-frequency SCG energy (p=0.02).
Valve disease patients showed SCG energy levels above the 90th percentile of the healthy cohort during late systole.
Visual Evidence
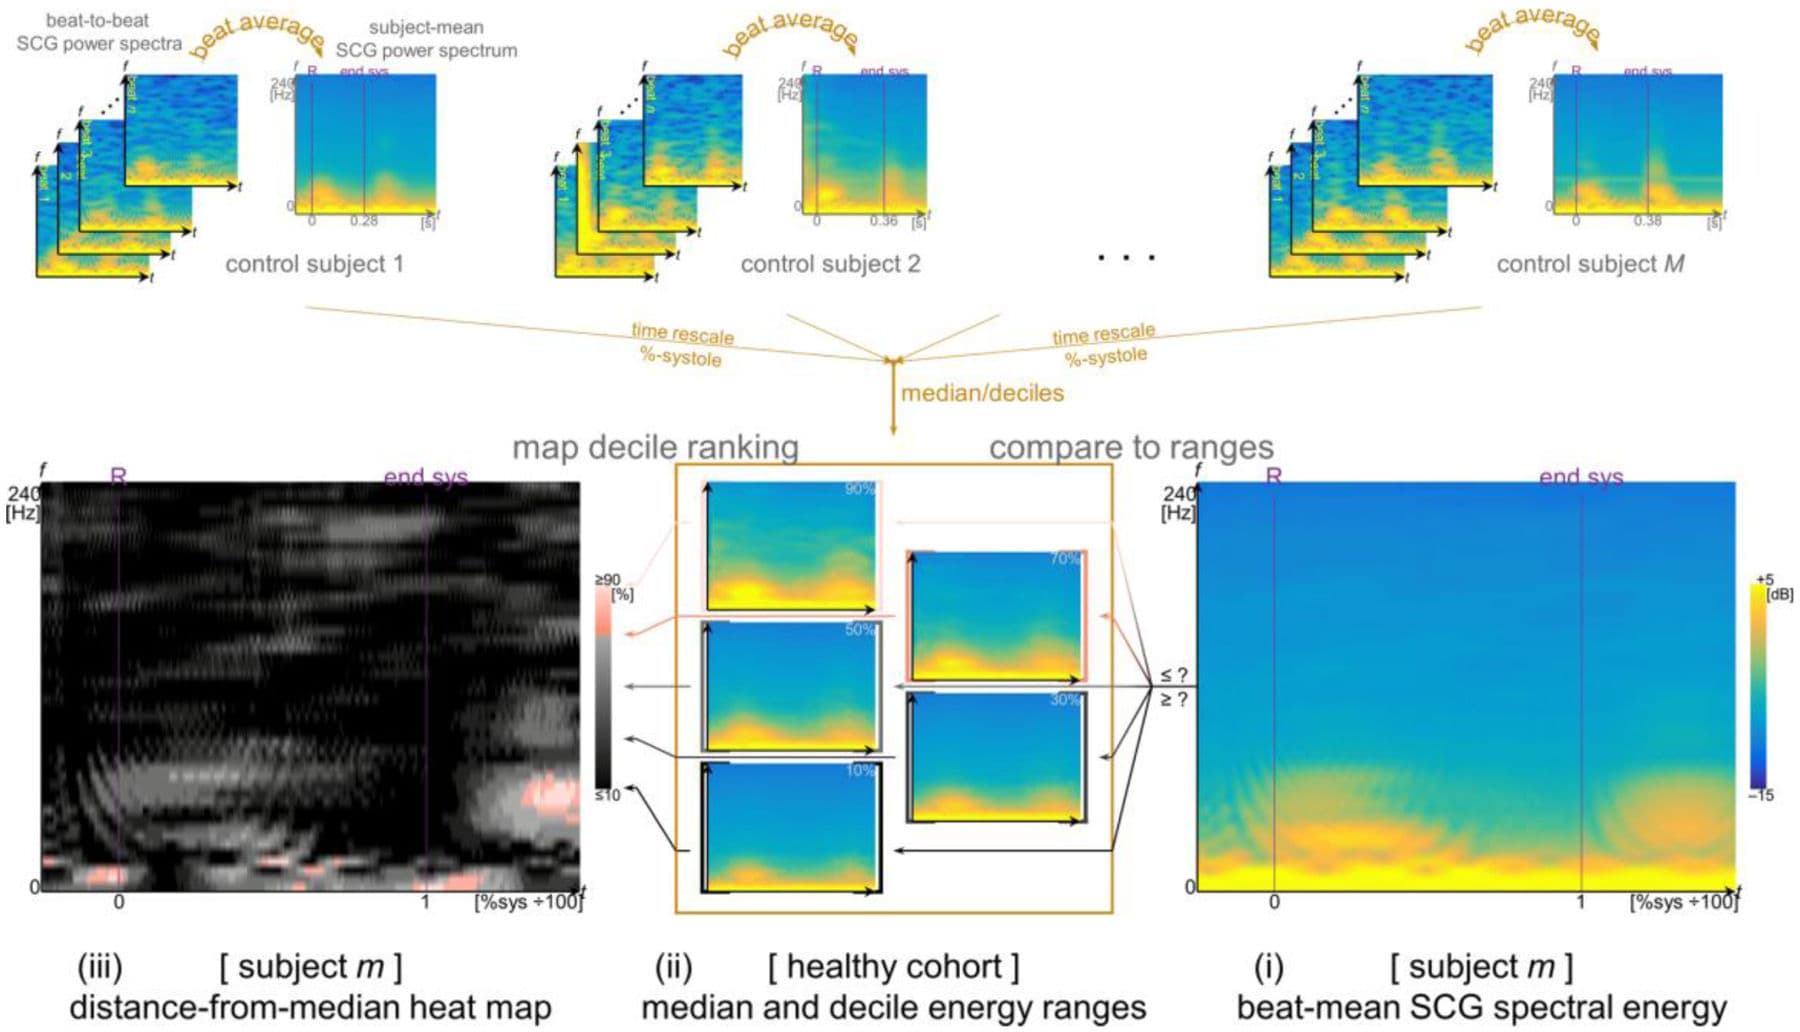
Figure 5. Normative median and decile ranges for SCG energies (middle) were aggregated from the beat-averaged SCG spectra of the healthy cohort (top). Individual subjects’ SCG energies (right) were compared to the quantiles to classify each frequency and time point according to deciles of energy levels. Decile rankings were coded into heat maps (left) indicating distance from the median, so that for example, a frequency and time point with SCG power exceeding that of 90% of the normal cohorts’ powers is shown light pink; and, conversely, a point at which the power is less than 90% of the normal cohorts’ powers (10% decile) is shown black.
Clinical Snapshot
Evidence Rating
Relevance
high Priority