Heart Rate Variability Analysis on Electrocardiograms, Seismocardiograms and Gyrocardiograms of Healthy Volunteers and Patients with Valvular Heart Diseases
Executive Summary
This study evaluates heart rate variability (HRV) indices derived from electrocardiograms (ECG), seismocardiograms (SCG), and gyrocardiograms (GCG) in healthy volunteers and patients with valvular heart diseases (VHD). Using time-domain, frequency-domain, and nonlinear HRV analyses, the study demonstrates strong linear correlations between HRV indices across these modalities, despite the influence of VHD on SCG and GCG waveforms. The findings validate the feasibility of using SCG and GCG for HRV analysis, offering a simpler and more cost-effective alternative to traditional ECG-based methods for cardiac monitoring.
Answer Machine Insights
Q: How reliable are SCG and GCG for HRV analysis compared to ECG?
SCG and GCG show strong linear correlations with ECG-derived HRV indices, proving their reliability for HRV analysis.
The results of the HRV analysis show a strong linear correlation with the HRV indices calculated from the ECG, SCG and GCG signals and prove the feasibility and reliability of HRV analysis despite the influence of VHDs on the SCG and GCG waveforms.
Q: What are the limitations of SCG and GCG in HRV analysis?
SCG and GCG are affected by inter-subject variability, sensor placement, and motion artifacts, which can influence signal quality.
However, the limitations of SCG and GCG include the inter-subject variability of signal morphology that can be significantly affected by cardiac diseases or sensor placement and susceptibility to motion artifacts.
Key Results
Strong linear correlation (ρ > 0.7) between HRV indices derived from ECG, SCG, and GCG signals in both healthy and VHD populations.
Significant differences in HRV indices (e.g., RMSSD, SD1/SD2) between healthy individuals and VHD patients, highlighting the impact of VHD on cardiac mechanics.
Visual Evidence
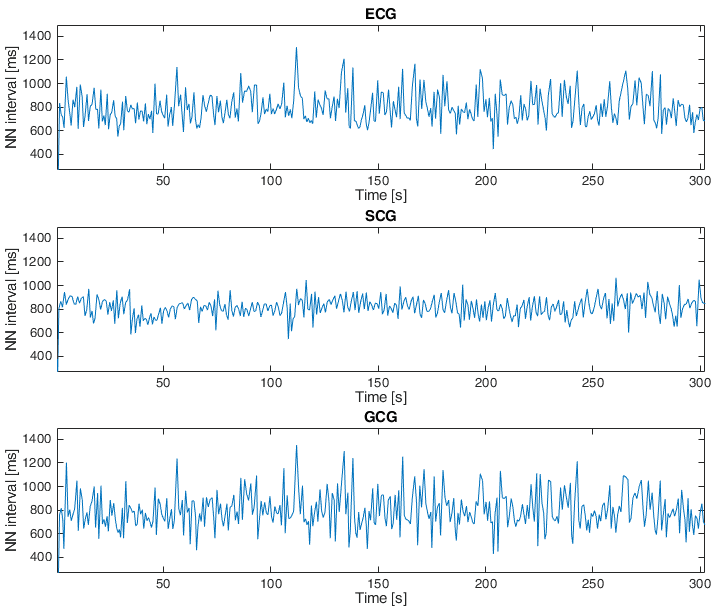
Figure 4. Tachogram derived from ECG, SCG and GCG signals taken from subject 9 in the first dataset (15-second fragment).
Clinical Snapshot
Evidence Rating
Relevance
high Priority