Estimation of Changes in Intracardiac Hemodynamics Using Wearable Seismocardiography and Machine Learning in Patients With Heart Failure: A Feasibility Study
Executive Summary
This feasibility study utilized wearable seismocardiography (SCG) signals and machine learning to estimate changes in pulmonary artery mean pressure (PAM) and pulmonary capillary wedge pressure (PCWP) during right heart catheterization (RHC) in heart failure (HF) patients. Using support vector regression (SVR) models, the study achieved high accuracy with R2 values of up to 0.95 for PCWP estimation. The findings suggest that wearable SCG technology could serve as a low-cost alternative for tracking hemodynamic congestion in HF patients, potentially enabling remote monitoring and reducing hospital readmissions.
Answer Machine Insights
Q: What was the accuracy of the regression model for estimating PCWP?
The regression model achieved an R2 of 0.95 and RMSE of 2.9 mmHg in the validation set.
The results show an RMSE of 2.9 mmHg, an NRMSE of 38%, an R2 of 0.95, and an LOA of 6.4 mmHg for the validation set for ΔPCWP.
Q: What physiological phases of SCG were most relevant for PAM and PCWP estimation?
Early systole was most relevant for PAM estimation, while late diastole was most relevant for PCWP estimation.
The changes in SCG during the early systole (isovolumetric contraction, IVC, period) provided the most relevant information related to changes in the PAM, whereas the changes in the SCG signals during atrial systole (active ventricular diastolic period) provided the most pertinent information regarding changes in PCWP.
Key Results
R2 of 0.93 and RMSE of 1.85 mmHg for PCWP estimation in the training-testing set.
R2 of 0.95 and RMSE of 2.9 mmHg for PCWP estimation in the validation set.
Visual Evidence
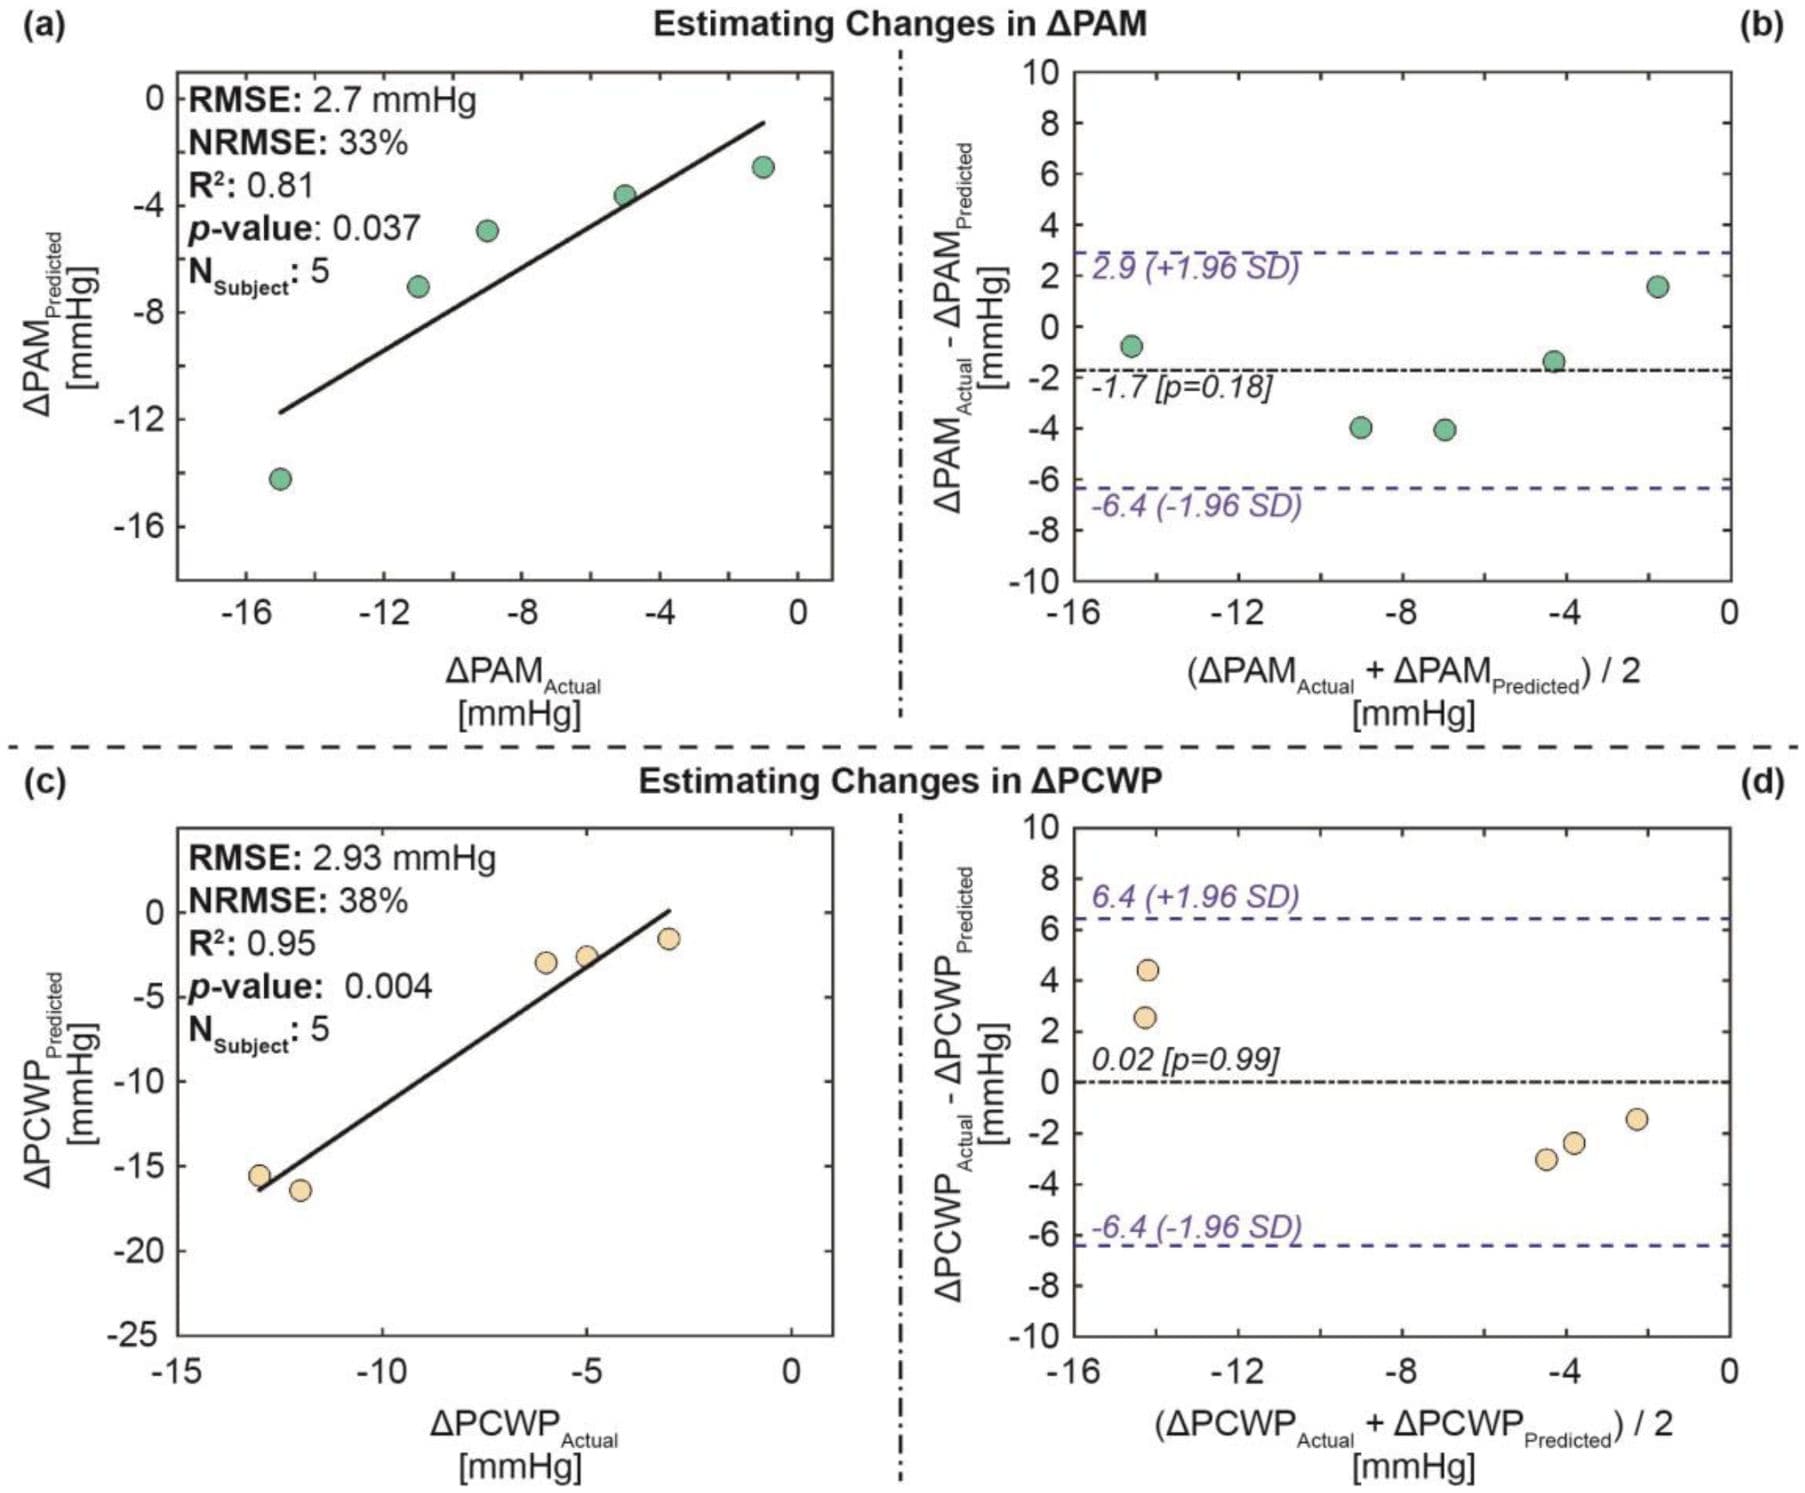
Fig. 7. Estimation results for the validation set: (a) Correlation analysis for ΔPAM predicted vs. ΔPAM actual, (b) Bland-Altman analysis for ΔPAM predicted and ΔPAM actual, (c) correlation analysis for ΔPCWP predicted vs. ΔPCWP actual, and (d) Bland-Altman analysis for ΔPCWP predicted and ΔPCWP actual. In the Bland-Altman plots, the black line indicates the mean, while the blue dashed lines indicate mean ± 1.96 × standard deviation (SD).
Clinical Snapshot
Evidence Rating
Relevance
high Priority