Assessment of left ventricular twist by 3D ballistocardiography and seismocardiography compared with 2D STI echocardiography in a context of enhanced inotropism in healthy subjects
Executive Summary
This study investigates the relationship between left ventricular (LV) twist mechanics and metrics derived from ballistocardiography (BCG) and seismocardiography (SCG) signals in healthy subjects under enhanced inotropism induced by dobutamine. Using 3-axis micro-accelerometers and gyroscopes, the study demonstrates that linear velocity metrics from BCG are superior predictors of LV twisting and untwisting rates compared to SCG. Additionally, metrics such as integral kinetic energy (iK) and maximal power (PMax) derived from BCG and SCG signals strongly correlate with LV ejection fraction (LVEF), accounting for 49% of its variance, suggesting potential applications in monitoring cardiac contractility and hemodynamics.
Answer Machine Insights
Q: Which metrics best predict LV twisting and untwisting rates?
Linear velocity metrics from BCG are the best predictors of LV twisting and untwisting rates.
The generalized linear model shows that the linear VMax of the BCG is the best predictor of the LV twisting and untwisting rates, rather than the VMax of the SCG.
Q: How well do BCG and SCG metrics correlate with LVEF?
Metrics of iK and PMax from BCG and SCG signals correlate strongly with LVEF, with R = 0.7, p < 0.0001.
By empirically combining the metrics computed from the BCG and SCG signals with the HR, two mathematical models have been built, in which PMax and iK are the metric which strongest correlates with LVEF (both R = 0.7, p < 0.0001).
Key Results
Linear velocity metrics from BCG predict LV twisting and untwisting rates with high accuracy (R = 0.50, p < 0.0001).
Metrics of iK and PMax from BCG and SCG signals correlate strongly with LVEF (R = 0.7, p < 0.0001), accounting for 49% of its variance.
Visual Evidence
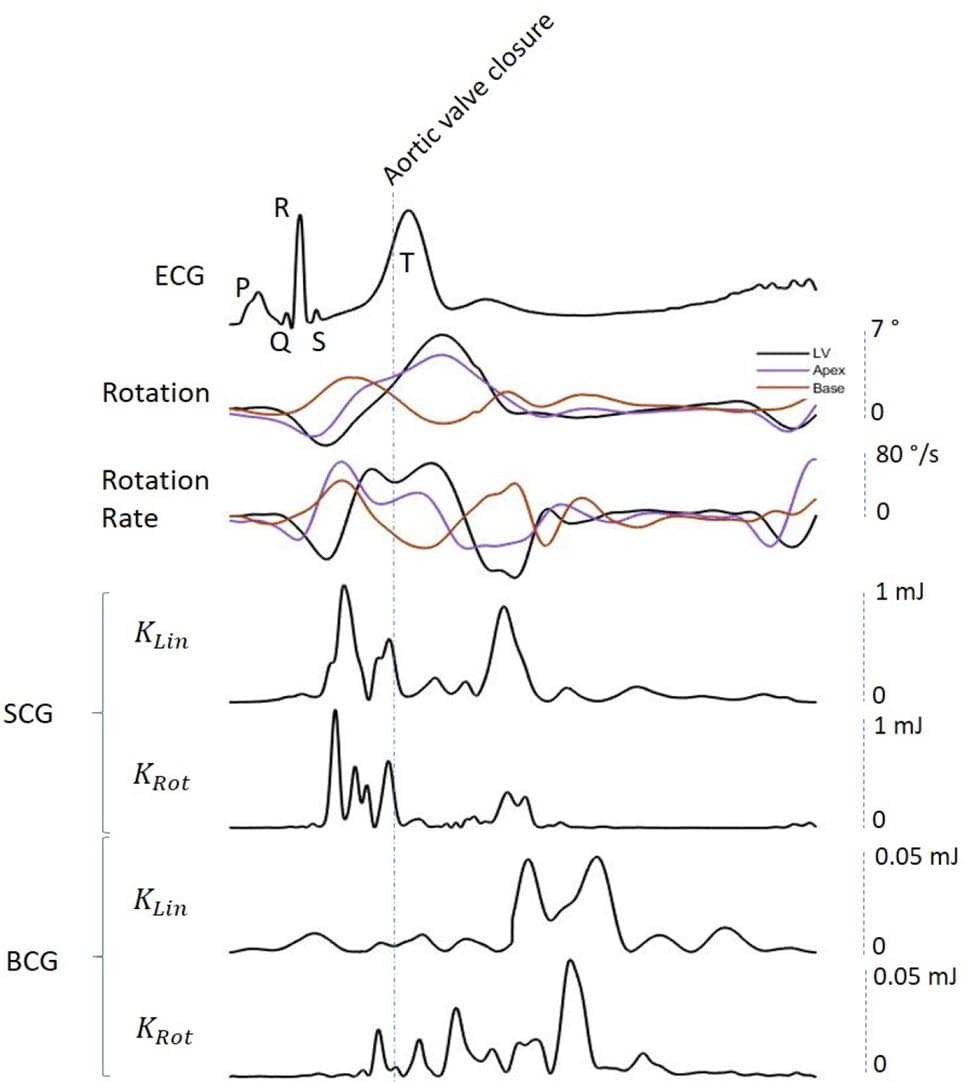
Figure 1. Synchronization of SCG and BCG signals with LV twist. From top to bottom: (a) ECG with the P-Q- R-S-T waves labeled; (b) LV twist, apical and basal rotations; (c) angular rates of LV twist, apical and basal twist rotations; (d) KLin SCG; (e) KRot SCG; (e) KLin BCG; (f) KRot BCG. The first of the two main peaks of KLin SCG (d) and KRot SCG (e) occurs before the aortic valve closure (AVC), during the ejection phase of cardiac cycle and concomitantly with the acceleration of LV twist; the second one occurs after the AVC, synchronously with the deceleration phase of LV twist. With regards to the BCG, waves of KLin and KRot occur almost exclusively after the AVC, during the diastolic phase of cardiac cycle. The Aortic Valve Closure (AVC) is labeled on the figure. KLin kinetic energy in the linear dimension, KRot kinetic energy in the rotational dimension, SCG seismocardiography, BCG ballistocardiography, ECG electrocardiogram, LV left ventricle.
Clinical Snapshot
Evidence Rating
Relevance
high Priority