Cardiovascular adaptation to simulated microgravity and countermeasure efficacy assessed by ballistocardiography and seismocardiography
Executive Summary
This study investigated the effects of 60-day head-down bed rest (HDBR) on cardiovascular deconditioning and evaluated the efficacy of high-intensity jump training as a countermeasure using portable cardiac monitoring (PCM) tools combining seismocardiography (SCG) and multi-dimensional ballistocardiography (BCG). Key findings include significant correlations between BCG metrics and stroke volume (SV) and VO2 max, demonstrating the ability of BCG to monitor cardiovascular adaptations. The study highlights the potential of SCG and BCG as non-invasive tools for assessing cardiac health in microgravity environments, where traditional imaging methods are limited.
Answer Machine Insights
Q: Can SCG and BCG metrics detect cardiovascular deconditioning during prolonged bed rest?
Yes, SCG and BCG metrics showed significant changes correlating with stroke volume and VO2 max during HDBR.
The evolution of iKBCG Lin sys followed the changes in SV and VO2 max in both groups.
Q: Did the exercise countermeasure mitigate cardiovascular deconditioning?
Yes, high-intensity jump training preserved stroke volume and VO2 max compared to the control group.
Short-duration high-intensity jump training may at least partially have counteracted cardiovascular deconditioning.
Key Results
BCG linear systolic kinetic energy (iKBCG Lin sys) correlated with stroke volume (R = 0.44, p < 0.05).
VO2 max showed a significant correlation with iKBCG Lin sys (R = 0.47, p < 0.05).
Visual Evidence
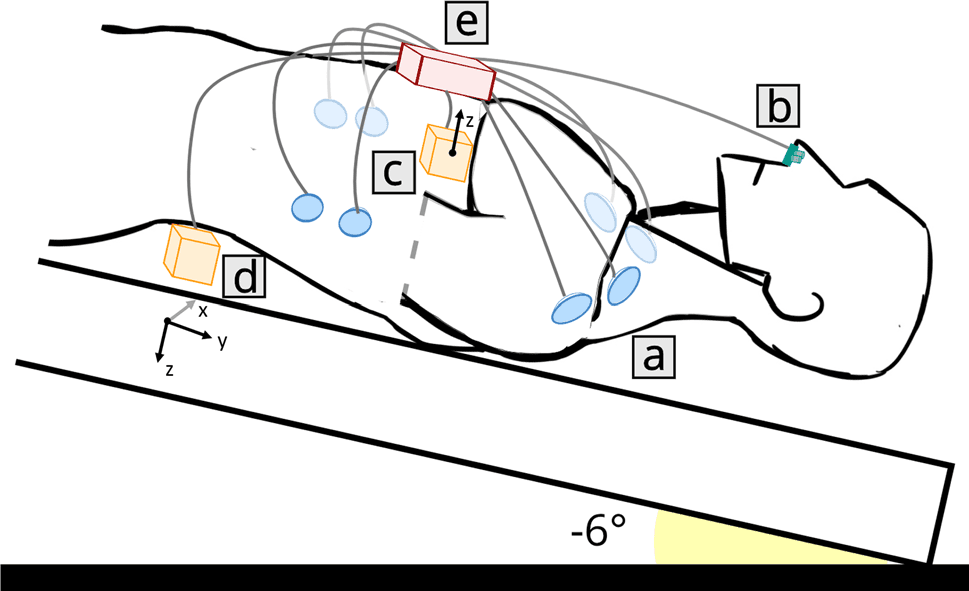
Figure 2. A schematic representation of the different elements of CARDIOVECTOR-1. (a) ECG/ICG electrodes; (b) PTG sensor (nasal thermistor); (c) SCG sensor at the cardiac apex (dorsoventral linear accelerations); (d) BCG sensor between the second and the third lumbar vertebrae (3-axis linear accelerations and 3-axis angular velocities); (e) Main unit (connection and amplification).
Clinical Snapshot
Evidence Rating
Relevance
high Priority