Discrete Wavelet Transforms-Based Analysis of Accelerometer Signals for Continuous Human Cardiac Monitoring
Executive Summary
This study evaluates two discrete wavelet transform (DWT)-based algorithms for detecting aortic valve opening (AO) peaks from seismocardiography (SCG) signals without relying on ECG. The methods, 'Slice and Detect' and 'Detect,' utilize biorthogonal and reverse-biorthogonal wavelets to enhance signal segmentation and peak detection. Both algorithms demonstrated low error rates in resting states but struggled with noisy signals during breathing tasks. The findings suggest potential for real-time cardiac monitoring applications, particularly in supine or resting conditions, such as during MRI scans.
Answer Machine Insights
Q: What is the primary advantage of the proposed algorithms?
The algorithms enable AO peak detection from SCG signals without requiring ECG, making them suitable for simpler and more affordable instrumentation.
This study proposes two methods to improve peak detection from noisy seismocardiography data. They rely on discrete wavelet transform analysis using either biorthogonal 3.9 or reverse biorthogonal 3.9.
Q: How do the algorithms perform in noisy environments?
Both algorithms struggled with noisy signals during breathing tasks, with error rates increasing significantly compared to resting states.
However, the breathing tasks challenged both, lowering their performances.
Key Results
Error rates for AO detection in resting states were as low as 2.1% for adults using the 'Detect' algorithm.
Breathing tasks increased error rates significantly, with 'Detect' showing a total error rate of 28.5% during breath-hold tasks.
Visual Evidence
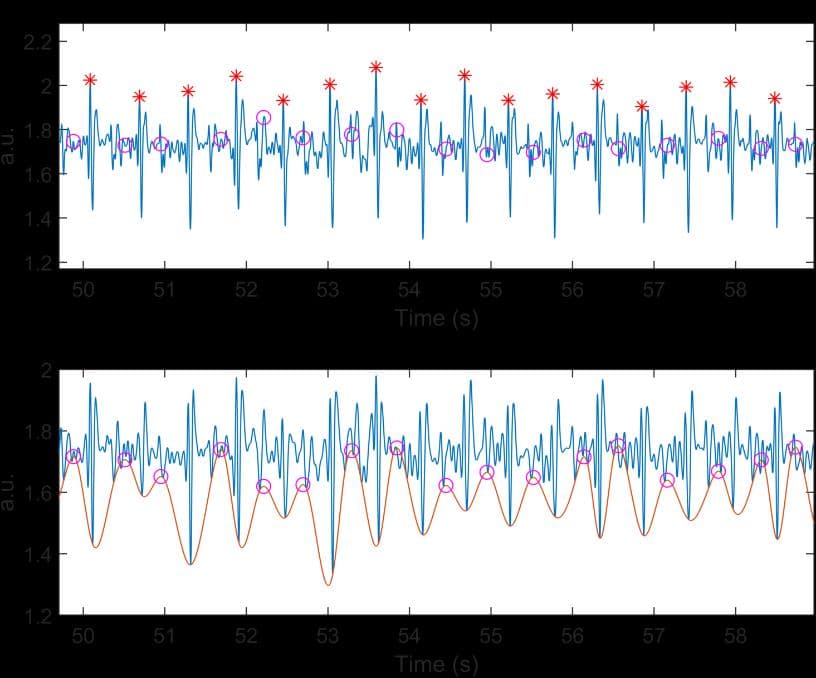
Figure 7 displays results from Slice and Detect. The top plot shows the original signal with its detected peaks (*) and starting points of the cardiac cycle (o), whereas the bottom plot displays the Approximation signal and its lower envelope.
Clinical Snapshot
Evidence Rating
Relevance
high Priority