Heart Rate Variability Analysis on Electrocardiograms, Seismocardiograms and Gyrocardiograms on Healthy Volunteers
Executive Summary
This study evaluates heart rate variability (HRV) indices derived from electrocardiograms (ECG), seismocardiograms (SCG), and gyrocardiograms (GCG) in healthy volunteers and patients with valvular heart diseases (VHD). Using time, frequency, and nonlinear domain analyses, the study demonstrates strong linear correlations between HRV indices from ECG and SCG/GCG signals, even in the presence of VHD-induced waveform distortions. The findings validate the feasibility of using SCG and GCG for HRV analysis, offering a simpler and cost-effective alternative to traditional ECG-based methods.
Answer Machine Insights
Q: How reliable are SCG and GCG for HRV analysis compared to ECG?
SCG and GCG show strong linear correlations (ρ > 0.7) with ECG-derived HRV indices, demonstrating their reliability.
The results presented in Table 6 indicate a strong linear correlation for the p-value under 0.001, except for SD1/SD2 between ECG and SCG signals from VHD patients.
Q: What HRV indices are most affected by valvular heart disease?
Indices such as RMSSD, pNN50, HF, LF/HF, SD1, and SD1/SD2 are significantly affected by VHD.
Valvular heart disease significantly affects RMSSD, pNN50 (only SCG and GCG signals), VLF (only ECG and SCG signals), HF (only SCG and GCG signals), LF/HF, SD1 and SD1/SD2.
Key Results
Strong linear correlation (ρ > 0.7) between HRV indices derived from ECG and SCG/GCG signals in both healthy and VHD populations.
Significant differences in HRV indices (e.g., RMSSD, SD1/SD2) between healthy individuals and VHD patients, confirming the impact of VHD on HRV metrics.
Visual Evidence
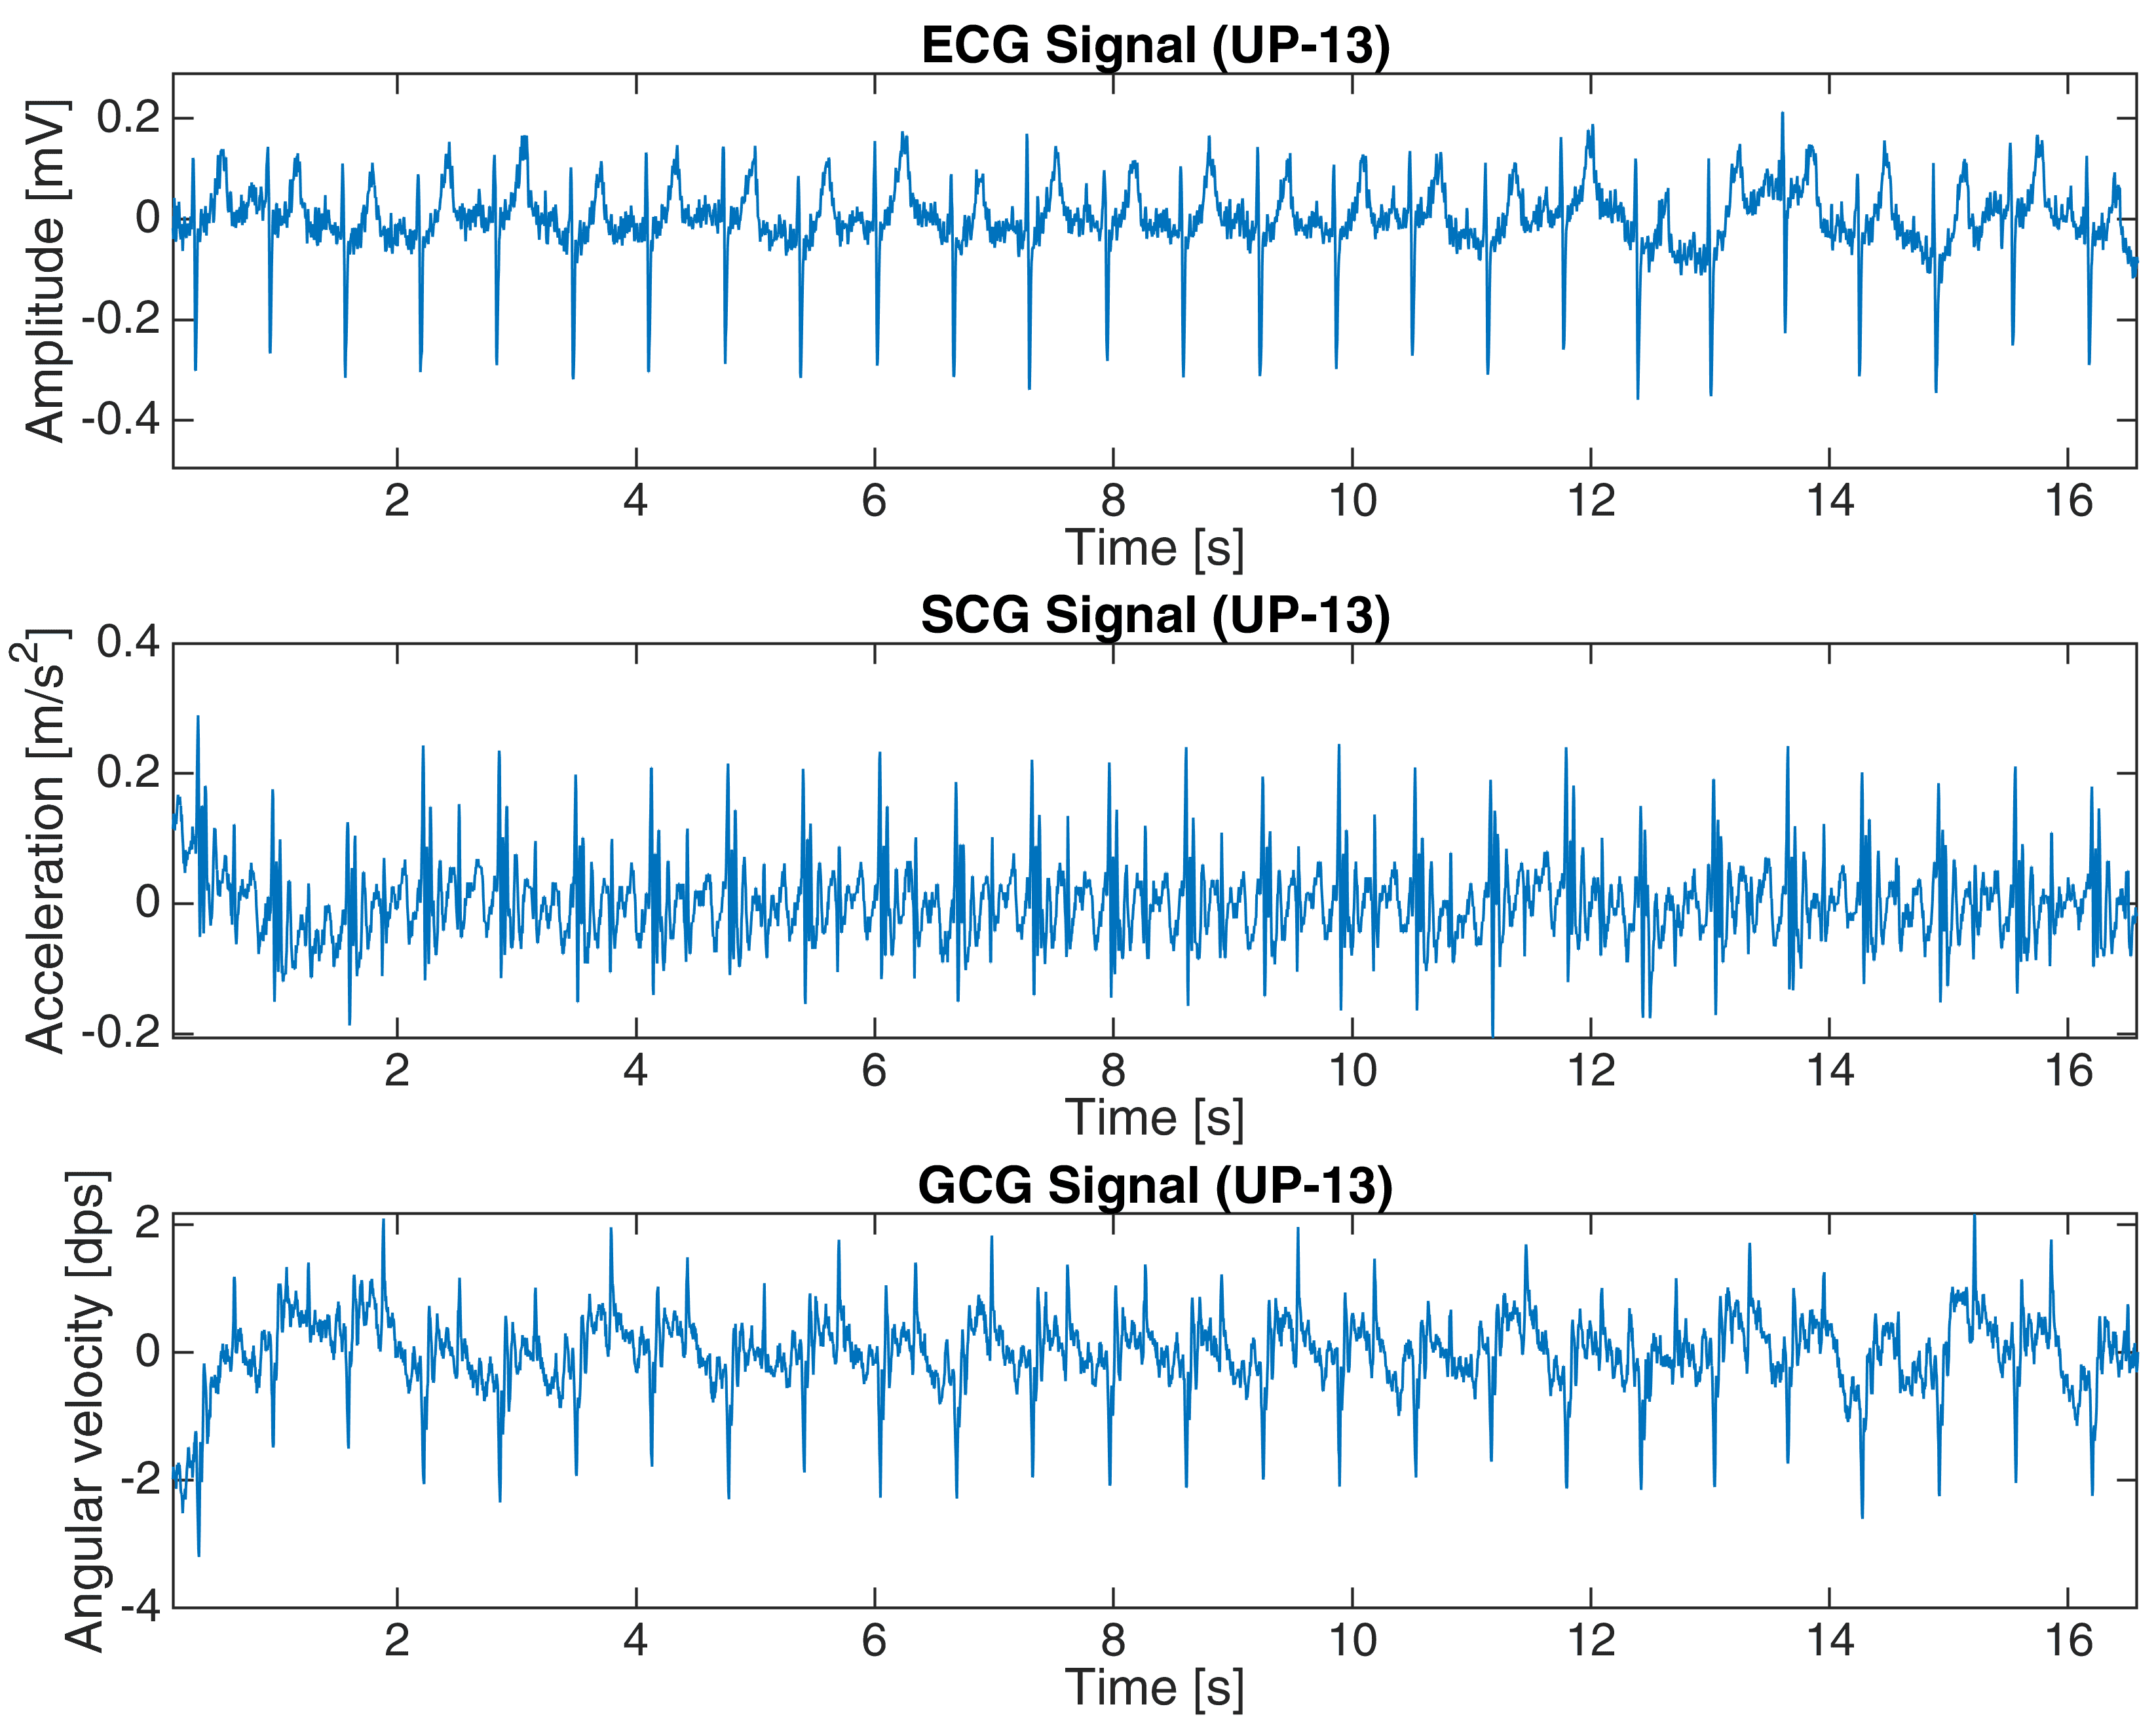
Figure 3. ECG, SCG and GCG signals from subject UP-13 in the second dataset (16-s fragment).
Clinical Snapshot
Evidence Rating
Relevance
high Priority