Cardiac Time Intervals Derived from Electrocardiography and Seismocardiography in Different Patient Groups
Executive Summary
This study evaluates the use of single-lead ECG and 3-axis seismocardiography (SCG) to extract cardiac time intervals (CTIs) in different patient groups, including those with severe aortic stenosis undergoing transcatheter aortic valve implantation (TAVI). Using a custom algorithm incorporating dynamic time warping (DTW) and ensemble averaging, the study demonstrates statistically significant changes in CTIs post-TAVI, aligning with findings from echocardiography-based methods. The results suggest the feasibility of SCG-based CTI extraction as a simpler alternative to imaging techniques for assessing cardiac function.
Answer Machine Insights
Q: What changes in cardiac time intervals were observed post-TAVI?
Post-TAVI, LVET decreased by 12.6% and PEP/LVET increased by 30.2%, both statistically significant (p < 0.05).
Comparing CTIs between the subjects who had data recorded before and after receiving a TAVI procedure, a 12.6% postoperative reduction in LVET (p < 0.05) was found on average as well as a 30.2% increase in PEP/LVET (p < 0.05).
Q: How does the proposed method compare to echocardiography for CTI extraction?
The proposed method using SCG and ECG aligns with literature findings from echocardiography, demonstrating similar trends in CTIs across patient groups.
These results are in line with literature where LVET increases with severe AS and age as well as decreases after TAVI procedures.
Key Results
LVET was reduced by 12.6% post-TAVI (p < 0.05).
PEP/LVET ratio increased by 30.2% post-TAVI (p < 0.05).
Visual Evidence
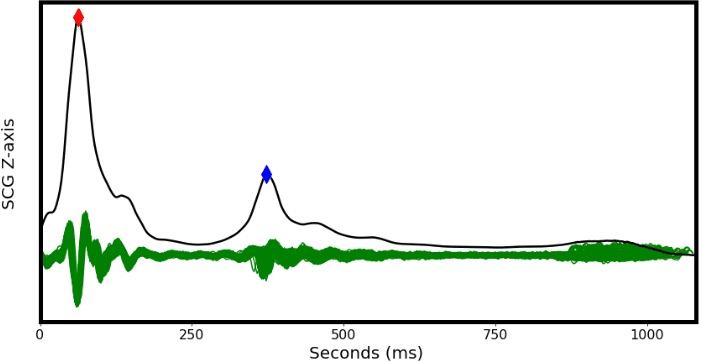
Figure 4: Example of AO (Red Diamond) and AC (Blue Diamond) extraction from CCAvg waveform. Green signal represents the grouped cardiac cycles used to create CCAvg.
Clinical Snapshot
Evidence Rating
Relevance
high Priority