Toward Wearable Estimation of Tidal Volume via Electrocardiogram and Seismocardiogram Signals
Executive Summary
This study introduces a wearable chest patch leveraging ECG and SCG signals to estimate tidal volume (TV) using multimodal demodulation techniques and machine learning. The subject-independent model achieved an RMSE of 181.45 mL and a Pearson correlation coefficient of 0.61, demonstrating improved accuracy compared to prior methods. The findings highlight SCG amplitude modulation (AM) as the most salient feature for TV estimation, paving the way for unobtrusive respiratory monitoring in diverse settings.
Answer Machine Insights
Q: What is the most salient feature for tidal volume estimation?
SCG amplitude modulation (AM) features are the most salient for tidal volume estimation.
In Figure 5 a), the SCGy,am, dorsoventral (DV) amplitude modulated component of SCG, feature is the most salient compared to other SCG directions and demodulation techniques.
Q: How does the model perform compared to prior studies?
The model achieves an RMSE of 181.45 mL and r of 0.61, outperforming prior ECG-only methods with RMSE of 235.6 mL and r of 0.26.
The ECG features alone achieve a RMSE of 235.6 mL and r of 0.26 while SCG features achieve 203.6 mL and 0.49, respectively. When adding SCG AM features, the RMSE improves to 181.45 mL and r to 0.61.
Key Results
Root-mean-square error (RMSE) of 181.45 mL for tidal volume estimation.
Pearson correlation coefficient (r) of 0.61 using a subject-independent model.
Visual Evidence
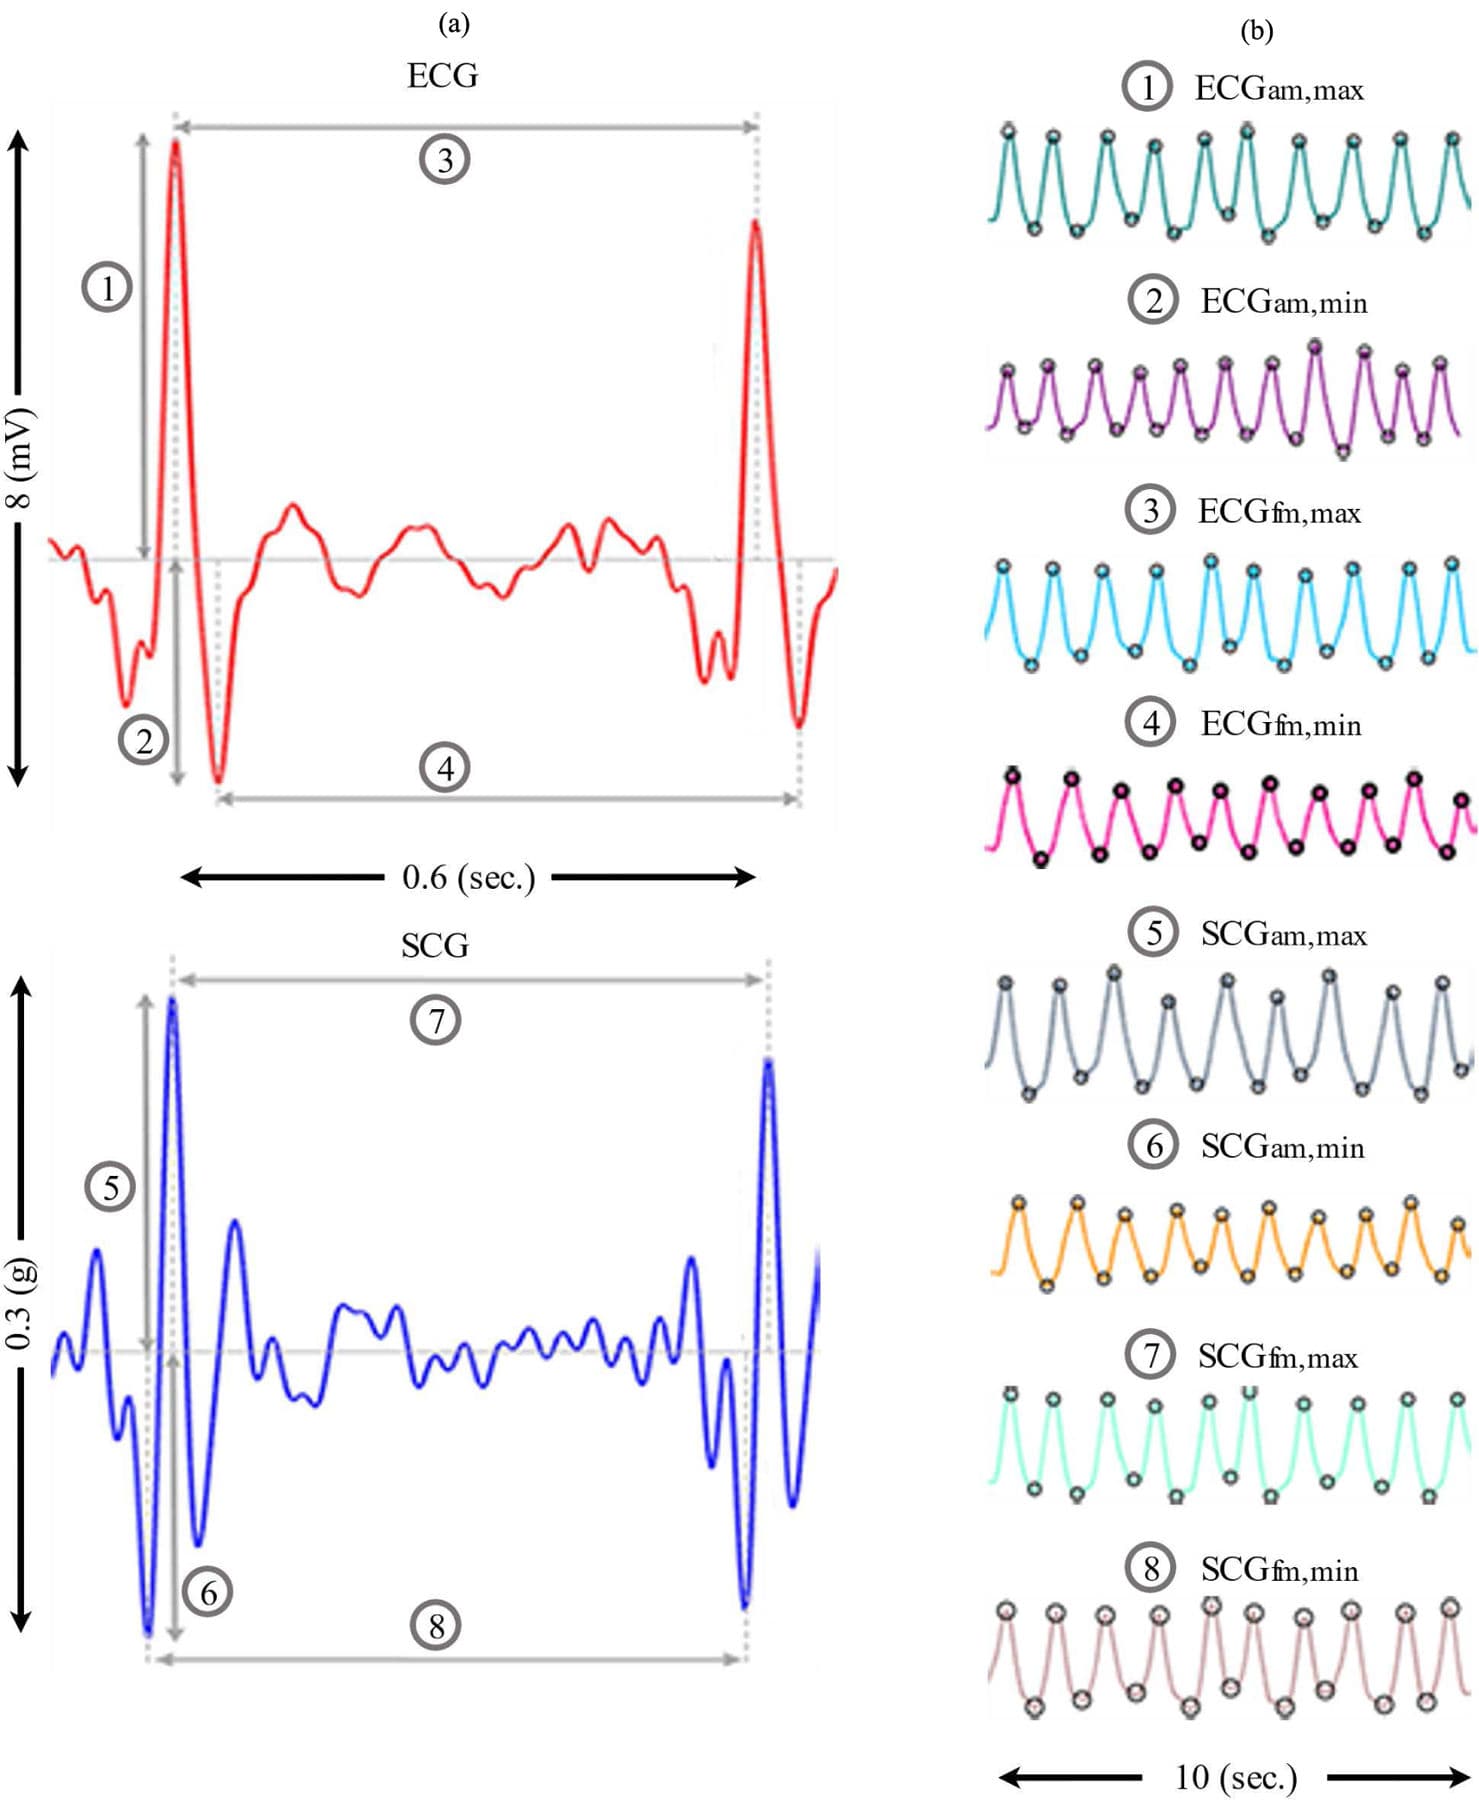
Fig. 3. a) Description of the extracted respiration features from ECG (top) and SCG (bottom). Amplitude features are numbered 1, 2 for ECG and 5, 6 for SCG. While frequency features are numbered 3, 4 for ECG and 7,8 for SCG. b) The corresponding TV is extracted from the features in a) by detecting peaks and valleys.
Clinical Snapshot
Evidence Rating
Relevance
high Priority