Definition of Fiducial Points in the Normal Seismocardiogram
Executive Summary
This study defines fiducial points in the seismocardiogram (SCG) and correlates them with physiological events identified in ultrasound images for 42 healthy subjects. Using synchronized SCG, ECG, and echocardiography data, the authors manually annotated fiducial points and established correlations with eight cardiac events, including valve openings and closures. The findings demonstrate strong correlations (e.g., r = 0.94 for aortic valve closure) and suggest SCG's potential for non-invasive cardiac diagnostics, particularly in identifying cardiac cycle events with high temporal precision.
Answer Machine Insights
Q: What is the correlation between SCG fiducial points and aortic valve closure?
The fiducial point Bd in SCG correlates strongly with aortic valve closure (r = 0.94, p < 0.001).
The shortest time difference between the fiducial point of the SCG and the time point for aortic valve closure is −5 ms (±12 ms) and is located at point Bd. The correlation between the fiducial point and time point is 0.94 (p < 0.001).
Q: How accurately does SCG detect mitral valve opening?
SCG fiducial point Fd shows a mean difference of −7 ms (±19 ms) with mitral valve opening, with a correlation of r = 0.87 (p < 0.001).
For the MO time point a combination of the tissue Doppler image and the onset of the E-wave in the pulsed wave Doppler was used. The shortest mean time difference of −7 ms (±19 ms) is to the fiducial point Sd. The correlation is 0.87 (p < 0.001).
Key Results
Correlation coefficient for aortic valve closure and SCG fiducial point Bd: r = 0.94 (p < 0.001).
Mean difference between mitral valve opening and SCG fiducial point Fd: −7 ms (±19 ms), r = 0.87 (p < 0.001).
Visual Evidence
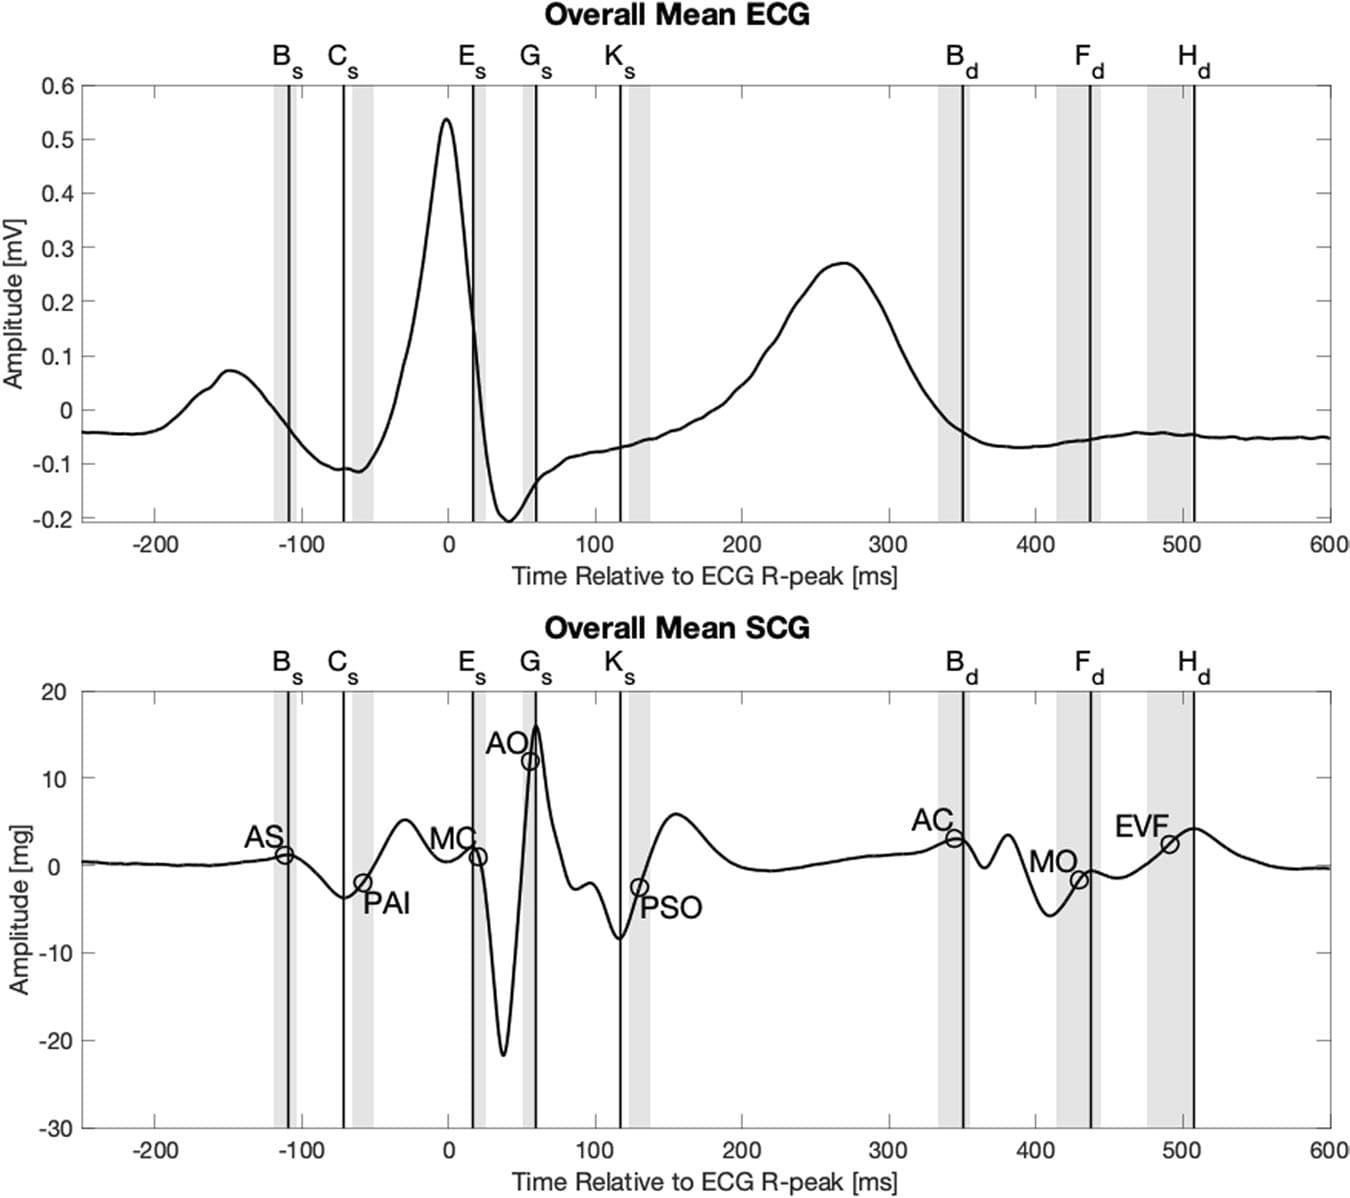
Figure 4. Overall mean electrocardiogram and seismocardiogram signal from 34 subjects. The circles indicate the mean location of the following physiologic events found in ultrasound images, from left: Atrial systole (AS), peak atrial inflow (PAI), mitral valve closure (MC), aortic valve opening (AO), peak systolic outflow (PSO), aortic valve closing (AC), mitral valve opening (MO), early ventricular filling (EVF). The grey areas indicate the 95% confidence intervals of the means for the physiologic events found in the ultrasound images.
Clinical Snapshot
Evidence Rating
Relevance
high Priority