Respiratory Modulation of Sternal Motion in the Context of Seismocardiography
Executive Summary
This study investigates the modulation of seismocardiography (SCG) signals by respiration, aiming to integrate respiratory monitoring into a single wearable device alongside cardiac monitoring. Using data from 40 healthy participants, the authors analyzed amplitude modulation, frequency modulation, and baseline wandering effects on SCG signals. Respiratory rate estimation achieved an r-squared value of 0.71 using baseline wandering, while tidal volume estimation faced challenges due to inter-subject variability. A multivariate linear regression model predicted respiratory waveforms with an average r-squared of 0.76, demonstrating SCG's potential for integrated cardiorespiratory monitoring.
Answer Machine Insights
Q: How accurately can SCG estimate respiratory rate?
Respiratory rate estimation using baseline wandering achieved an r-squared value of 0.71.
Estimation from baseline wandering produced r-squared values of 0.71.
Q: Can SCG predict the respiratory waveform?
Yes, using multivariate linear regression, SCG predicted respiratory waveforms with an average r-squared of 0.76.
The respiratory waveform was estimated using linear regression with an average r-squared of 0.764.
Key Results
Respiratory rate estimation achieved an r-squared value of 0.71 using baseline wandering.
Respiratory waveform prediction using multivariate linear regression achieved an average r-squared of 0.76.
Visual Evidence
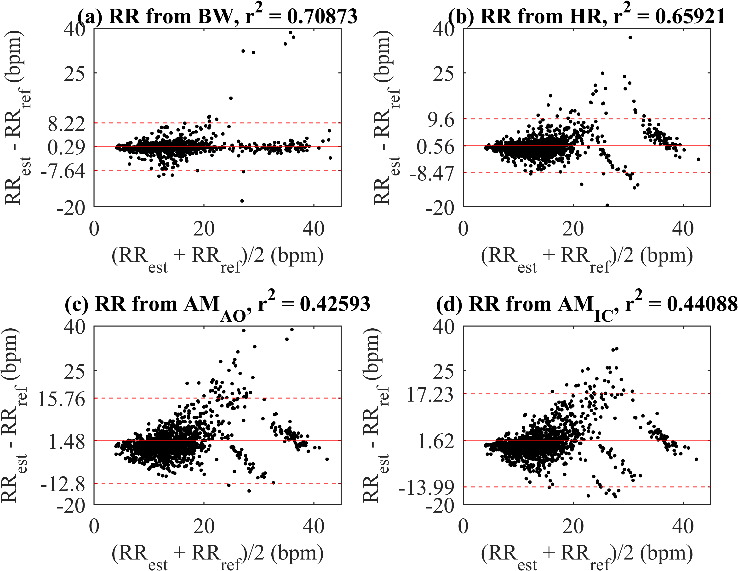
Fig. 7. Bland-Altman plots of estimated (RRest) and reference (RRref) respiration rate with mean (solid red) and 95% limits of agreement (dashed red) for: (a) X-axis baseline wandering, (b) Heart rate, (c) AO amplitude modulation, and (d) IC amplitude modulation.
Clinical Snapshot
Evidence Rating
Relevance
high Priority