Porcine Model for Validation of Noninvasive Estimation of Pulmonary Hypertension
Executive Summary
This study utilized a porcine model to validate the use of seismocardiography (SCG) for non-invasive detection of pulmonary hypertension (PH). SCG signals were analyzed during induced hypoxemia and hypercapnia, showing significant prolongation in isovolumetric contraction time (IVCT) and isovolumetric relaxation time (IVRT), as well as increased left ventricular ejection time (LVET) under hypercapnia. These findings suggest SCG's potential as a diagnostic tool for PH, offering advantages over echocardiography in terms of cost, accessibility, and continuous monitoring.
Answer Machine Insights
Q: What changes in SCG time intervals were observed under hypoxemia?
Hypoxemia caused a significant increase in relative isovolumetric contraction time (IVCT) and isovolumetric relaxation time (IVRT).
The SCG signals showed, in hypoxemia, a significant prolongation (in % relative to the RR-interval) in isovolumetric contraction time (IVCT) from 4.48% (± 1.36) to 5.58% (± 1.88) (p = 0.01), and isovolumic relaxation time (IVRT) from 7.33% (± 1.72) to 9.64% (± 3.84) (p =0.00).
Q: How did hypercapnia affect left ventricular ejection time (LVET)?
Hypercapnia significantly increased LVET from 34.6% to 41.0%.
In hypercapnia, left ventricular ejection time (LVET) significantly increased from 34.6% (± 6.0) to 41.0% (± 10.8) (p =0.03).
Key Results
Relative isovolumetric contraction time (IVCT) increased significantly from 4.48% to 5.58% under hypoxemia (p = 0.01) and from 4.18% to 6.61% under hypercapnia (p = 0.00).
Relative isovolumetric relaxation time (IVRT) increased significantly from 7.33% to 9.64% under hypoxemia (p = 0.00) and from 7.33% to 11.9% under hypercapnia (p = 0.00).
Visual Evidence
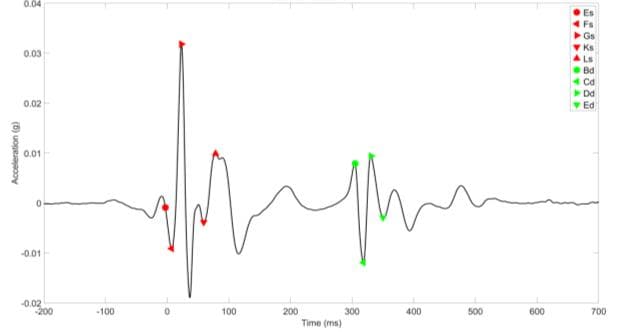
Figure 1: Demonstration of SCG with fiducial points used in the study. The red marks are the systolic and the blue marks are the diastolic variables. IVCT = Isovolumetric cardiac ejection time, LVET = Left ventricular ejection time, IVRT = Isovolumetric relaxation time, g = gravita- tional constant.
Clinical Snapshot
Evidence Rating
Relevance
high Priority